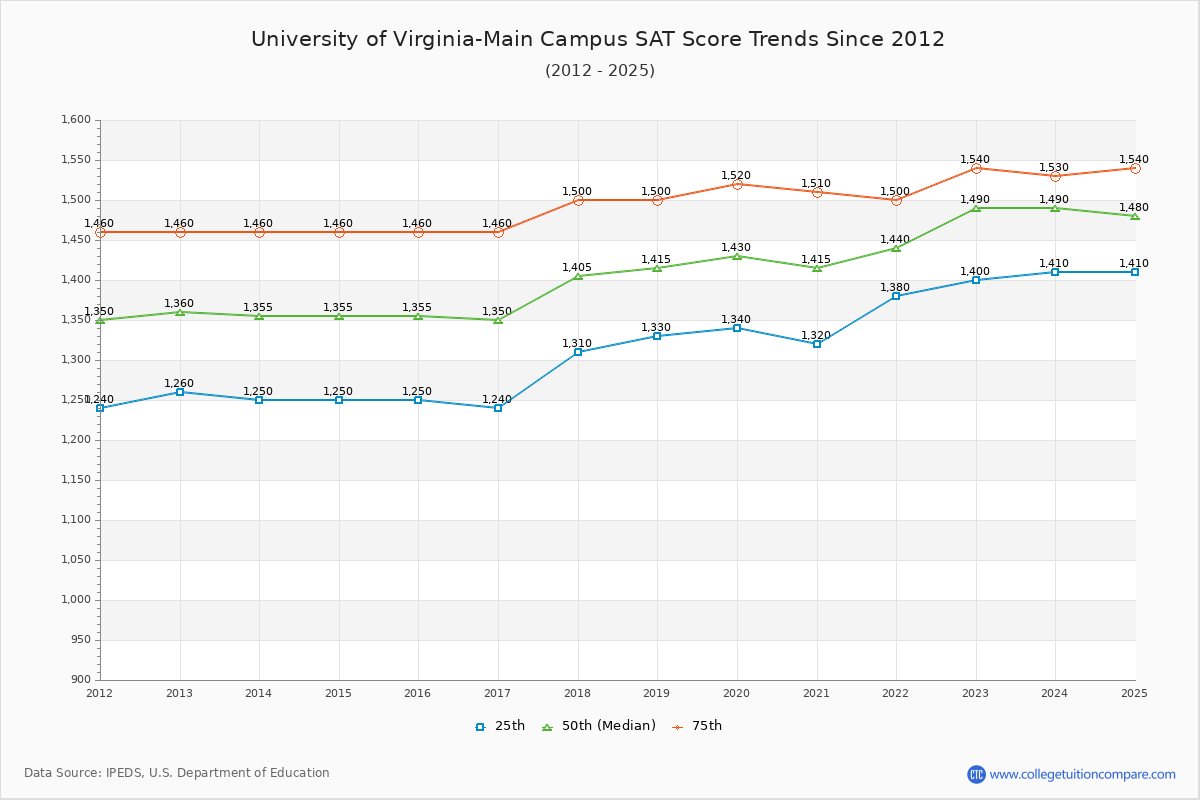
The SAT score have been increased 135 points since 2013 and the SAT score went up and down almost every year at UVA. Compared to similar schools, the submitted SAT and ACT scores are extremely competitive and high at UVA.
You can check and compare colleges with similar SAT scores UVA by SAT score range 1390-1490, 1440-1540, and 1490-1590.
The 2024 SAT score is 1490 at UVA. Over the past 12 years, the average SAT score is 1316 (25 th percentile) and 1495 (75 th percentile). Compared to similar schools, the submitted SAT scores are extremely competitive and high at UVA.
The following table and chart illustrate the changes in SAT scores at University of Virginia-Main Campus since 2013.
| Year | Total | Math | Evidence-Based Reading and Writing | ||||||
|---|---|---|---|---|---|---|---|---|---|
| 25 th | 50 th | 75 th | 25 th | 50 th | 75 th | 25 th | 50 th | 75 th | |
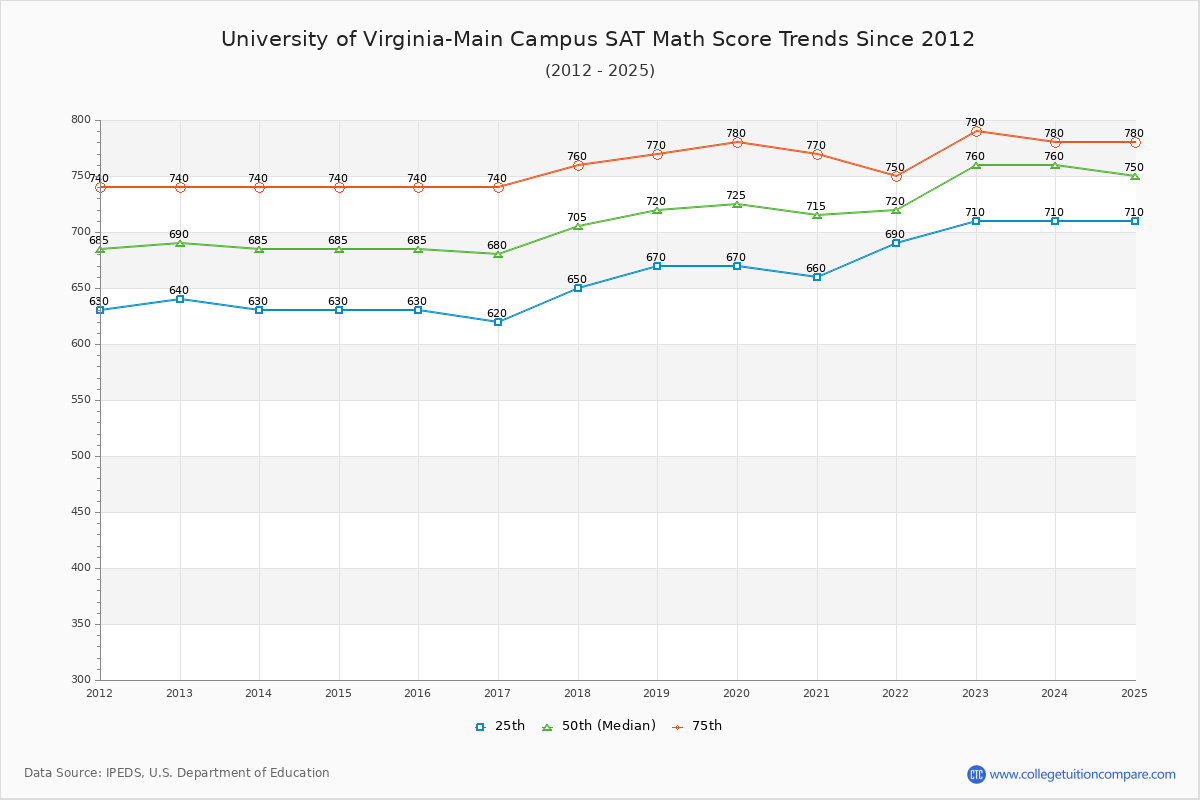
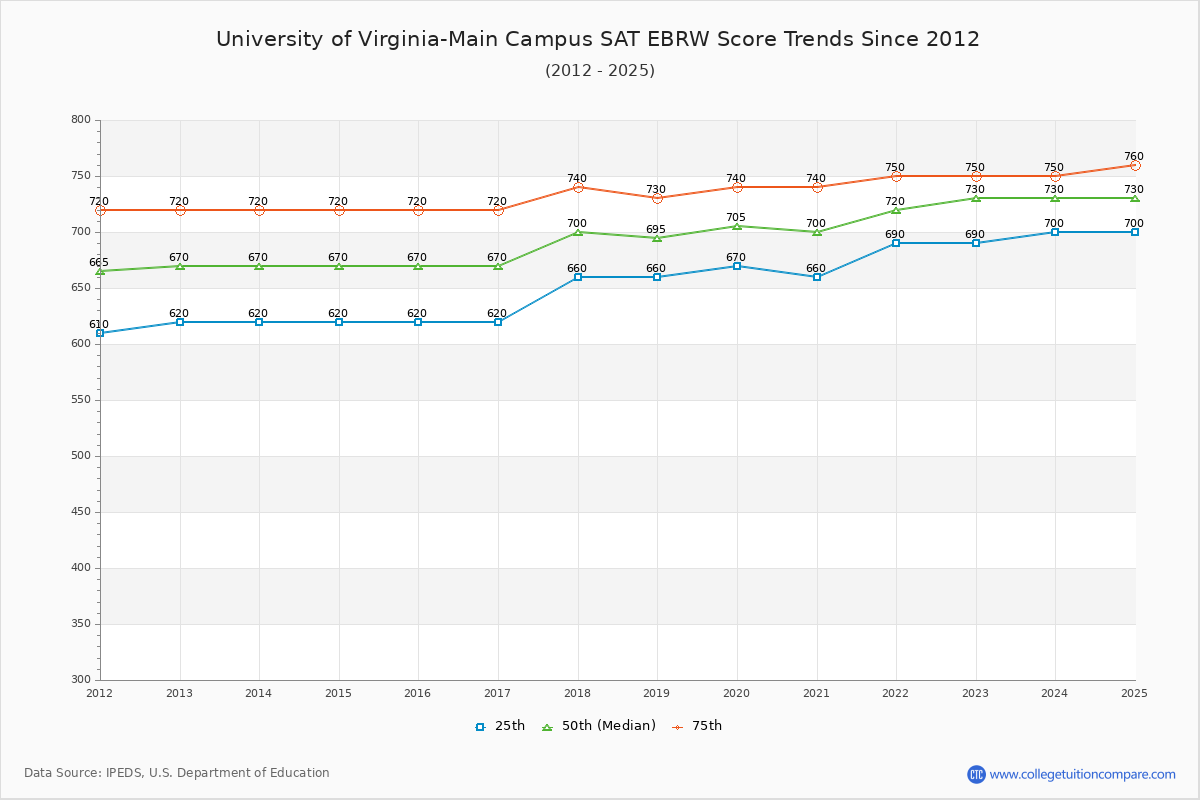
| 2013-14 | 1,250 | 1,355 | 1,460 | 630 | 685 | 740 | 620 | 670 | 720 |
| 2014-15 | 1,250 | 1,355 | 1,460 | 630 | 685 | 740 | 620 | 670 | 720 |
| 2015-16 | 1,250 | 1,355 | 1,460 | 630 | 685 | 740 | 620 | 670 | 720 |
| 2016-17 | 1,240 | 1,350 | 1,460 | 620 | 680 | 740 | 620 | 670 | 720 |
| 2017-18 | 1,310 | 1,405 | 1,500 | 650 | 705 | 760 | 660 | 700 | 740 |
| 2018-19 | 1,330 | 1,415 | 1,500 | 670 | 720 | 770 | 660 | 695 | 730 |
| 2019-20 | 1,340 | 1,430 | 1,520 | 670 | 725 | 780 | 670 | 705 | 740 |
| 2020-21 | 1,320 | 1,415 | 1,510 | 660 | 715 | 770 | 660 | 700 | 740 |
| 2021-22 | 1,380 | 1,440 | 1,500 | 690 | 720 | 750 | 690 | 720 | 750 |
| 2022-23 | 1,400 | 1,490 | 1,540 | 710 | 760 | 790 | 690 | 730 | 750 |
| 2023-24 | 1,410 | 1,490 | 1,530 | 710 | 760 | 780 | 700 | 730 | 750 |
| Average | 1316 | 1409 | 1495 | 661 | 713 | 760 | 655 | 696 | 735 |
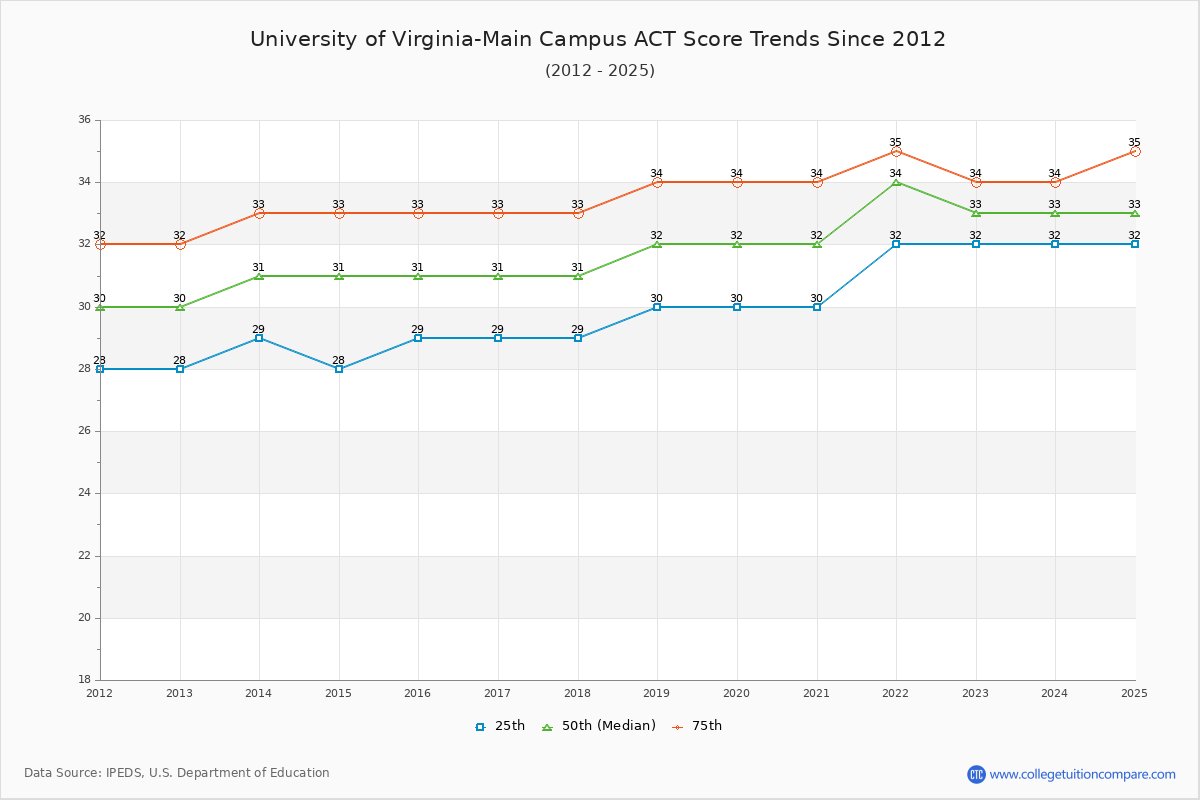
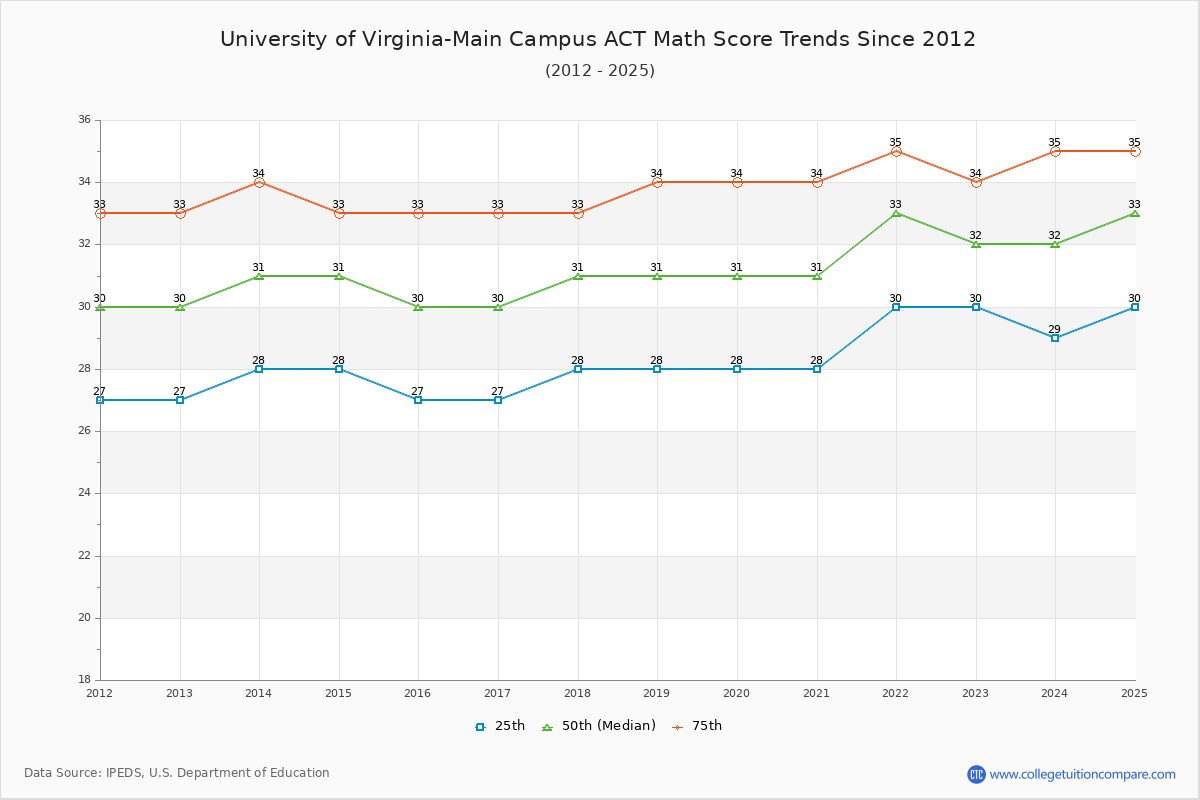
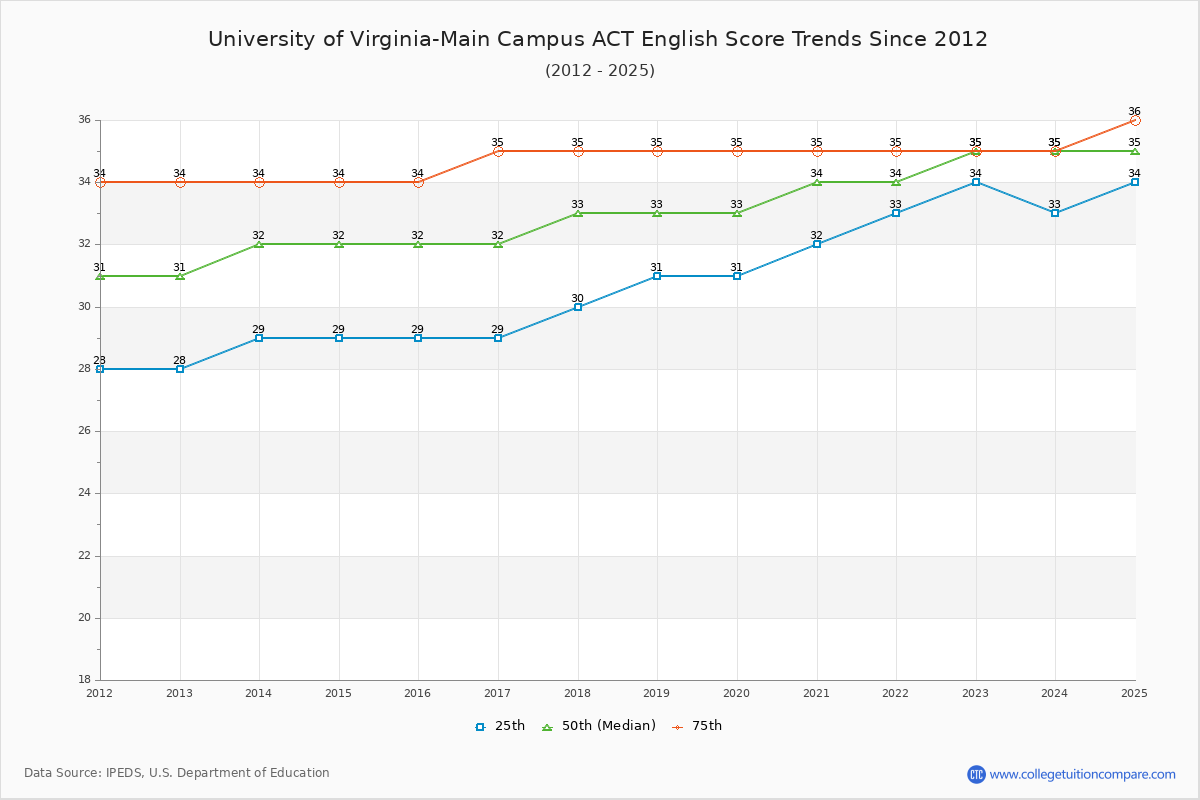
The 2024 ACT score is 33 at UVA. Over the past 12 years, the average ACT score of the last 12 years is 30 (25 th percentile) and 34 (75 th percentile). Compared to similar schools, the submitted ACT scores are extremely competitive and high at UVA.
The following table and chart show the changes in ACT scores at University of Virginia-Main Campus since 2013.
| Year | Composite | English | Math | ||||||
|---|---|---|---|---|---|---|---|---|---|
| 25 th | 50 th | 75 th | 25 th | 50 th | 75 th | 25 th | 50 th | 75 th | |
| 2013-14 | 29 | 31 | 33 | 29 | 32 | 34 | 28 | 31 | 34 |
| 2014-15 | 28 | 31 | 33 | 29 | 32 | 34 | 28 | 31 | 33 |
| 2015-16 | 29 | 31 | 33 | 29 | 32 | 34 | 27 | 30 | 33 |
| 2016-17 | 29 | 31 | 33 | 29 | 32 | 35 | 27 | 30 | 33 |
| 2017-18 | 29 | 31 | 33 | 30 | 33 | 35 | 28 | 31 | 33 |
| 2018-19 | 30 | 32 | 34 | 31 | 33 | 35 | 28 | 31 | 34 |
| 2019-20 | 30 | 32 | 34 | 31 | 33 | 35 | 28 | 31 | 34 |
| 2020-21 | 30 | 32 | 34 | 32 | 34 | 35 | 28 | 31 | 34 |
| 2021-22 | 32 | 34 | 35 | 33 | 34 | 35 | 30 | 33 | 35 |
| 2022-23 | 32 | 33 | 34 | 34 | 35 | 35 | 30 | 32 | 34 |
| 2023-24 | 32 | 33 | 34 | 33 | 35 | 35 | 29 | 32 | 35 |
| Average | 30 | 32 | 34 | 31 | 33 | 35 | 28 | 31 | 34 |
The following table compares SAT score changes from last year between University of Virginia-Main Campus and similar schools.
| 2024 | 2023 | Change % | |
|---|---|---|---|
| University of Virginia-Main Campus | 1490 | 1440 | 3.47% |
| University of North Carolina at Chapel Hill | 1460 | 1260 | 15.87% |
| Florida State University | 1290 | 1260 | 2.38% |
| Virginia Polytechnic Institute and State University | 1330 | 1310 | 1.53% |
| University of Miami | 1390 | 1380 | 0.72% |
| Georgia Institute of Technology-Main Campus | 1480 | 1405 | 5.34% |
Share your experiences and thoughts about University of Virginia-Main Campus. It will be a great help to applicants and prospective students!